How to Use Dental Practice Data to Overcome Production Slumps
Every dental practice hits a slow period. Chairs that were full in the spring sit empty for stretches in the summer. Post-holiday appointment drop-off dents January collections. A string of cancellations throws off an otherwise solid month. Production slumps are a normal part of running a practice — but how you respond to them separates practices that recover quickly from those that spend months trying to figure out what went wrong.
The answer isn’t more marketing spend or a new patient promotion. More often than not, the answer is already sitting in your practice data. The problem is that most practices either aren’t looking at that data consistently, or they don’t have a tool that makes it easy to act on what they see.
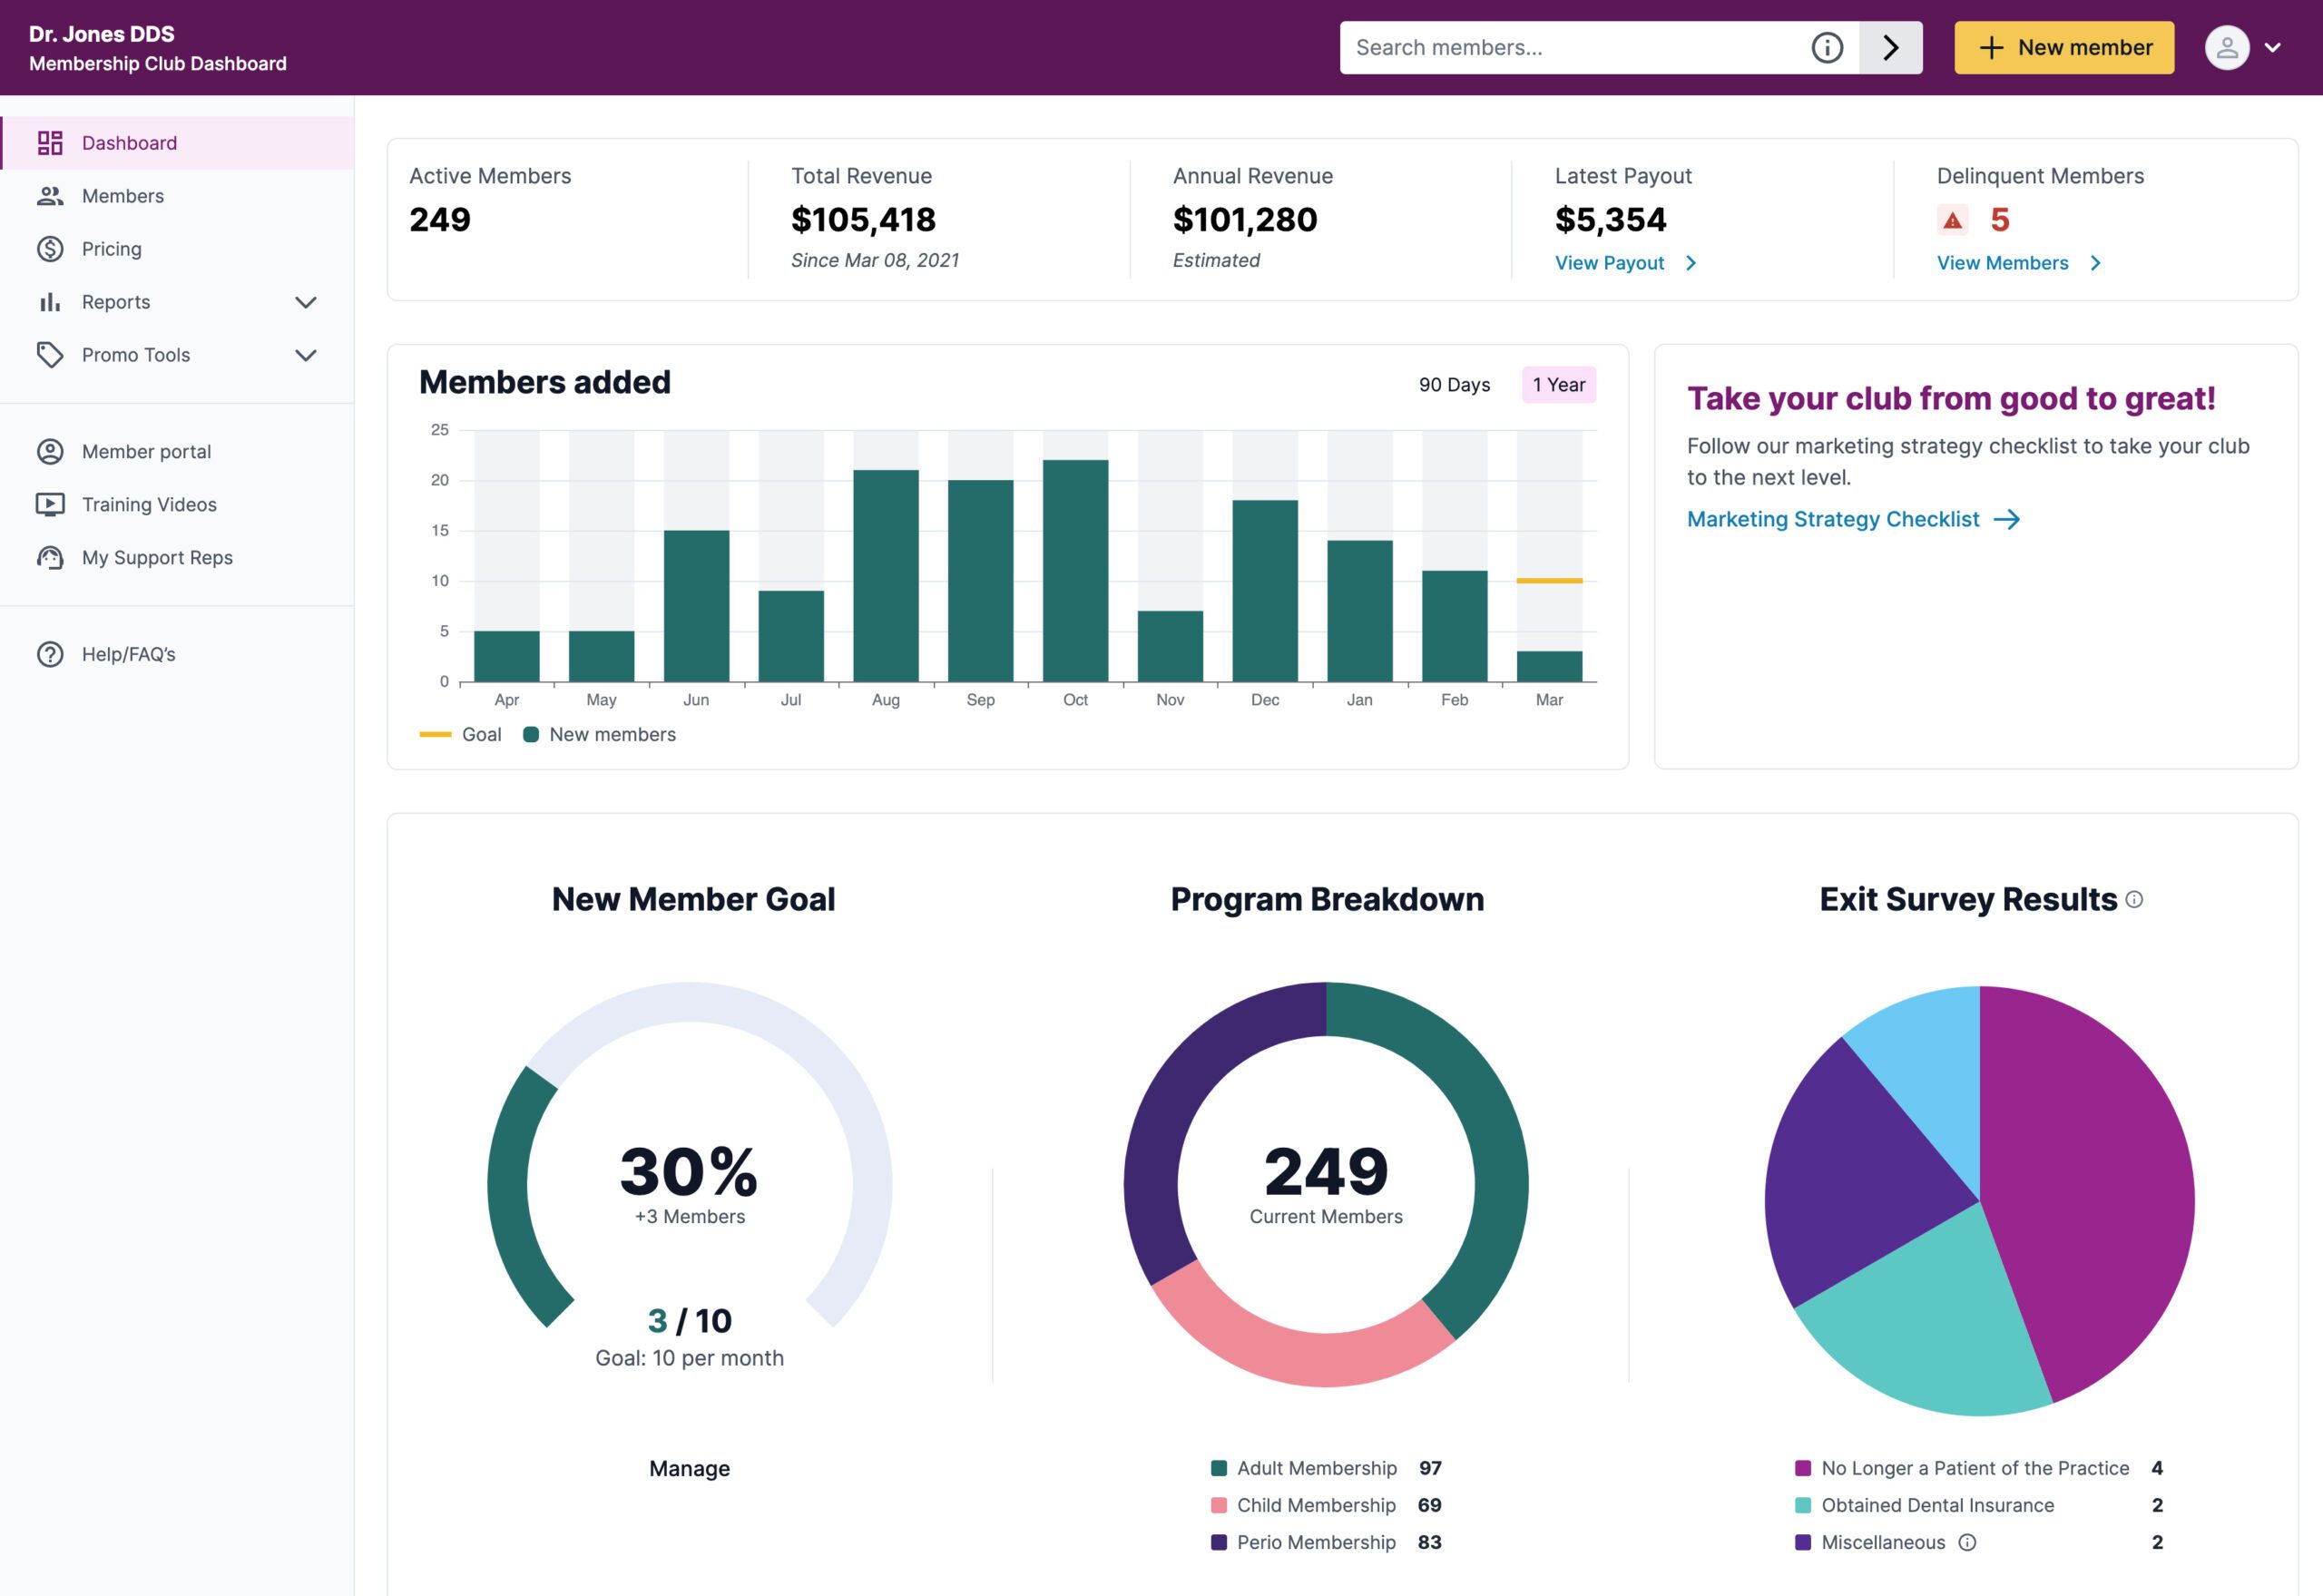
illumitrac’s real-time dashboard analytics and membership reporting give independent dental practices exactly that — a clear, always-on view of the numbers that determine whether your practice is growing, stagnating, or leaving revenue on the table.
The Data Most Practices Are Ignoring
Practice management software tracks appointments, procedures, and billing. What it doesn’t tell you clearly is the comparative revenue story — how much your membership patients are worth versus your PPO patients versus your uninsured cash-pay patients, and what your production potential looks like if you shift that mix.
That’s the lens illumitrac’s dashboard analytics provides. Rather than a static report you pull once a quarter, the dashboard gives you a live, at-a-glance breakdown of:
- Active membership numbers — how many patients are enrolled, broken down by plan tier
- Revenue generated by your membership club — month over month, tracked automatically
- Average patient value — so you can see clearly what a membership patient is worth compared to the rest of your patient base
- Membership growth trends — so you know whether your club is growing, plateauing, or losing members, and when
When a production slump hits, this data tells you something specific: is it a new patient problem, a retention problem, a treatment acceptance problem, or a membership mix problem? Each of those has a different solution, and without the data, you’re guessing.
Pulling the Levers on Your Revenue Mix
One of the most valuable things illumitrac’s reporting reveals is the production potential hidden in your existing patient base. Most practices have a mix of PPO patients, uninsured cash-pay patients, and — if they’re running a membership club — plan members. The revenue profile of each group is dramatically different.
Membership patients consistently outperform both PPO and uninsured cash-pay patients on average production per visit. They show up more reliably, accept more treatment, and refer more often. When you can see that gap clearly in your own dashboard — your numbers, your patients, your practice — the case for growing your membership club stops being theoretical and becomes obvious.
For practices considering dropping underpaying PPO plans, that data is especially powerful. The dashboard lets you model what your revenue would look like as your membership club grows and your PPO dependency shrinks — giving you a grounded, evidence-based path toward a fee-for-service model rather than a leap of faith.
Using Data to Drive Decisions, Not Just Reports
The practices that recover from production slumps fastest aren’t the ones that react to them — they’re the ones that see them coming. Consistent dashboard review makes that possible.
A few ways to build data review into your practice rhythm:
Monthly Membership Audits
Review active member count, revenue generated, and any failed payments flagged by the system. If membership numbers are flat or declining, that’s an early signal to address retention before it becomes a revenue problem.
Average Patient Value Tracking
Monitor how your membership patient value compares month over month. A drop in average value often points to a shift in treatment acceptance — something that can be addressed through front-desk training or membership benefit communication before it compounds.
Production Mix Analysis
As you grow your membership club, track what percentage of your monthly production is coming from members versus PPO versus cash-pay. Watching that ratio shift over time gives you the confidence to make bigger strategic decisions — like dropping a PPO plan — with real data behind the move rather than gut instinct alone.
The Dashboard Isn’t Just a Report — It’s a Growth Tool
Most practice owners think of analytics as a backward-looking exercise — something you review after the fact to understand what happened. illumitrac’s dashboard is designed to be forward-looking: a tool you check regularly to stay ahead of problems, spot opportunities, and make confident decisions about where your practice is headed.
Production slumps will happen. What changes when you have real-time membership analytics is that you’re never in the dark about why they’re happening — and you always have a clear, data-backed path to pulling out of them.
Explore illumitrac’s dashboard features and membership analytics →